Cloud Database Monitoring using SelectStar – Part VIII
We are going through the setup and
use of SelectStar, a new heterogeneous monitoring solution for cloud databases
from Blue Medora. In the previous blog post here,
we added an Oracle database from our on-premise server's collector. The Oracle database then
appeared in the SelectStar database overview page, and we then drilled down on the
recently added “SaiProd” Oracle database.
We had a look at the Alerts and
Recommendations displayed for this database, and were warned there were no
recent backups for the database. It was also recommended to multiplex the
database online redo log files and archive logs, and set up database flashback. In the
Advanced tab, we saw various graphs and pertinent information for this particular
database.
We moved back to the Overview page,
and clicked on the Queries graph to drill down to further detail. This
displayed the top Queries running in the database, meaning those with the
highest performance impact.
At this point, move back to the
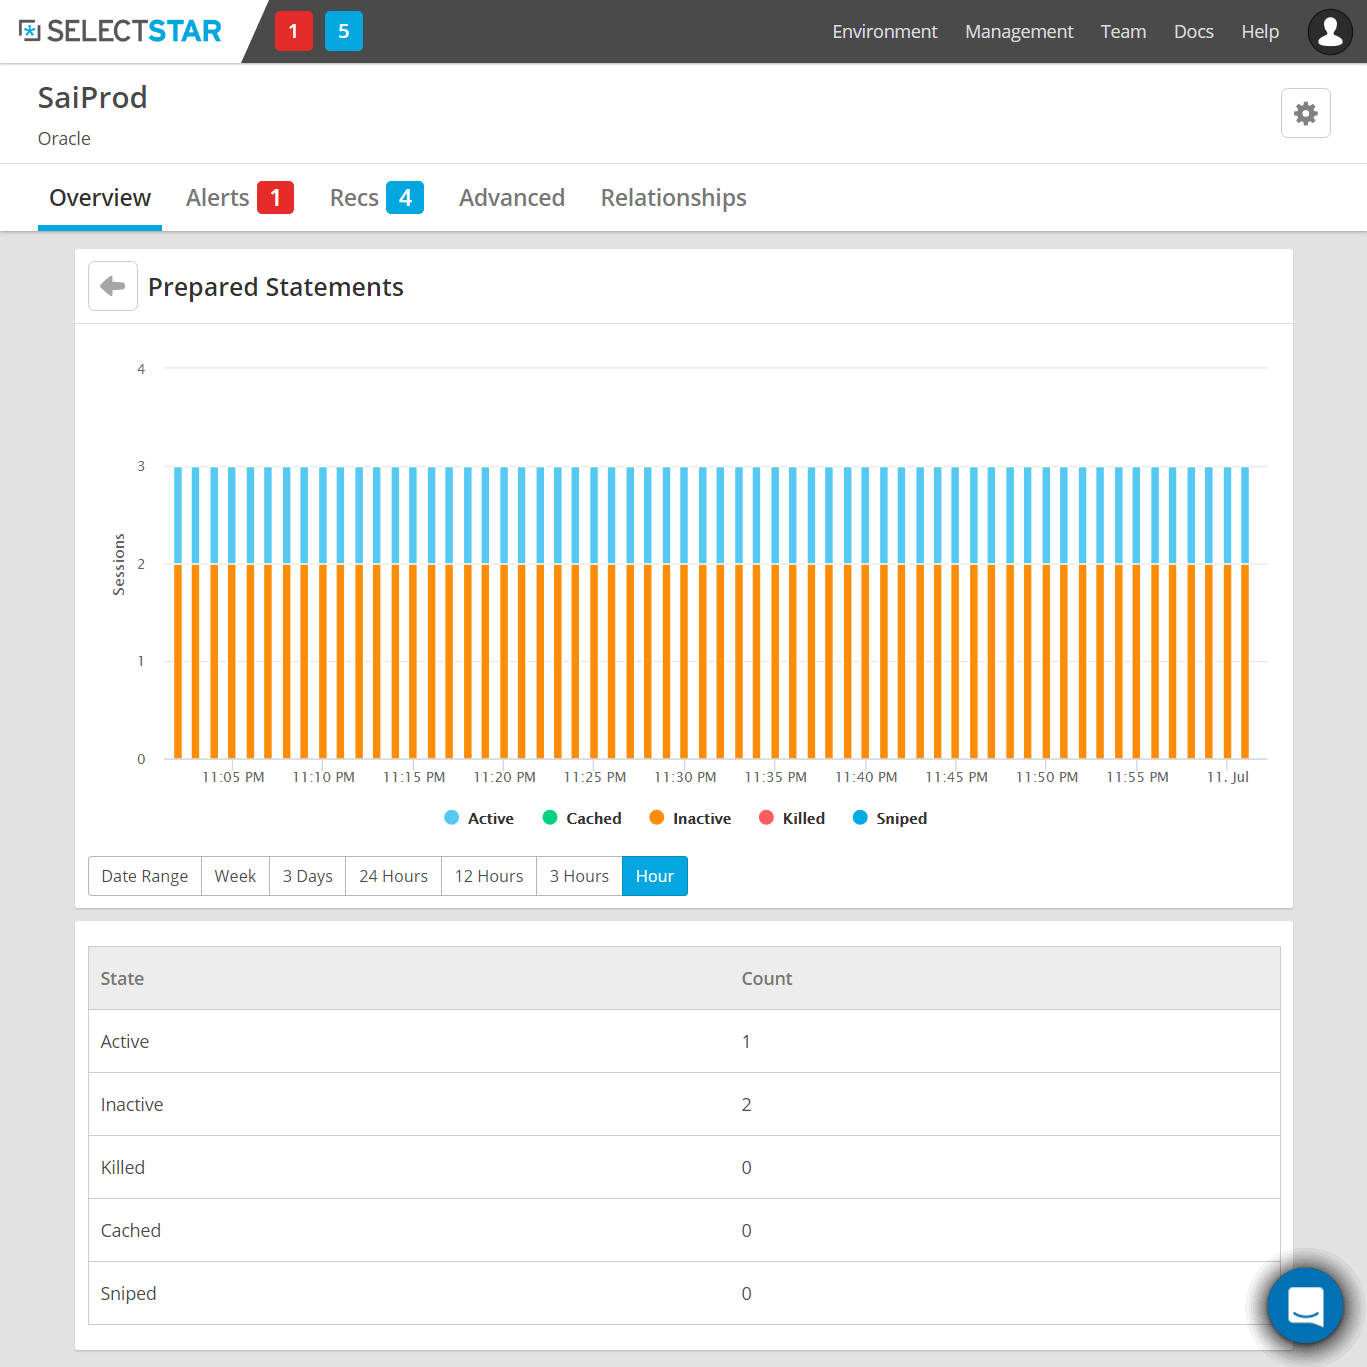
Overview page, and click on the Sessions tab.

This displays the active, inactive,
killed or cached sessions as shown below. You can select the date range as
before. The count of each type of session is shown in a table in the lower half of the screen.
Move back to the queries tab. Click
on one of the queries as displayed.

This drills down to the individual statement. You can click on the Show
All button to see all the statements again.

Move back to the Overview page. To
look at the Setup, go ahead and click on
the Setup gear button.

This brings up the configuration of
the Oracle connection as seen in the following image.

You can change the configuration
details here, test the connection and save it on this page. Next, click on the Alerts
link on this page.

On this page, you can modify the
existing Alert Rules, or add new rules. You can turn an Alert rule on or off.
As
you can see, some existing alert rules are based on sessions usage or processes
usages going beyond a critical threshold percentage, the days since the last
RMAN backup (we saw this alert in the initial investigation of this database), and
the datafile read time.
The session usage alert has been repeated twice, first
for the usage exceeding 100%, and another alert for the usage exceeding 70%.
This should be a warning alert and a critical alert, but in this case the
metric alert has been set up twice for two alerts. Let us click on the setup
gear button for one of the alerts.

On this page, we can modify the
Alert rule for the Sessions usage. The critical threshold can be set up with a new operator, value and unit, and the alert text can also be changed.
The
volatility is set to "Stable" which means it will only trigger the event after
three consecutive collections. The other options for the volatility are "Volatile" (trigger or resolve after ten consecutive collections), or "Immediate" (trigger or resolve immediately). You can also add a warning threshold on this
page.


Comments
Post a Comment